
From curbs to codes: digital infrastructure and data-driven planning for smarter mobility

Taken from “Intersections + Identities A Radical Rethinking of Our Transportation Experiences”, the 2022 State of Transportation Planning report produced by the Transportation Planning Division of the American Planning Association. The full report, including a special feature on the State of Transport by US Secretary of Transportation Pete Buttigieg, can be downloaded here
The increasing digitization of our everyday lives has created opportunities for planners to leverage digital solutions for more accurate, transparent, and collaborative transportation planning that supports a more equitable and sustainable future. As of April 2021, 85% of Americans owned smartphones, generating rich data on our locations and travel patterns (Pew Research Center, 2021). These smartphones connect us to transportation services and related information anytime, anywhere. Transportation networks and the communities they serve are also becoming increasingly digitized and connected, enabling more data-driven and informed planning. In 2020 there were 143 planned and operational connected vehicle deployments across the US with over 23,600 vehicle-based devices and 12,300 infrastructure deployments (USDOT, 2020). Transit vehicles (buses, light rail, and streetcar) are increasingly equipped with real-time location tracking devices, and the USDOT has supported connected technology pilots that integrate data from vehicles, transit, infrastructure, and personal devices (USDOT, 2022). Together with solutions like artificial intelligence and machine learning, these data can transform the way planning projects are designed and delivered to leverage digital transformation for smarter and more equitable mobility.
Disparate and daunting to dynamic data and insights
Transportation planning projects often rely on multiple sources of data to understand travel patterns and behaviors, develop alternative solutions, and test the ability of those alternatives to meet travelers’ needs and their environmental impacts. This data is often historic in nature, aggregated, and presented in static tables or charts, making it difficult for communities and decision makers to understand the connections between data and transportation solutions. Data presented as averages can also hide unique needs and impacts related to gender, race, and socioeconomic status. Historic data, while fundamentally important to understand long-term past trends, may not reflect more recent changes (for example the dramatic changes brought on by the pandemic). Dynamic data dashboards enable planners to more transparently present data and associated analyses. As part of the Bay Area Transit recovery vision, AECOM partnered with the nonprofit Seamless Bay Area to explore how post-pandemic transit network and investment scenarios could serve Communities of Concern, including persons with limited English proficiency, zero-vehicle households, seniors, persons with one or more disability, single-parent families, and renters paying over half their income for housing (AECOM and Seamless Bay Area, 2020). Using Microsoft’s PowerBI tool and AECOM’s Mobilitics™ scenario planning tool, scenario factors can be toggled on and off or adjusted to see how accessibility changes for these specific communities (AECOM, n.d.).]
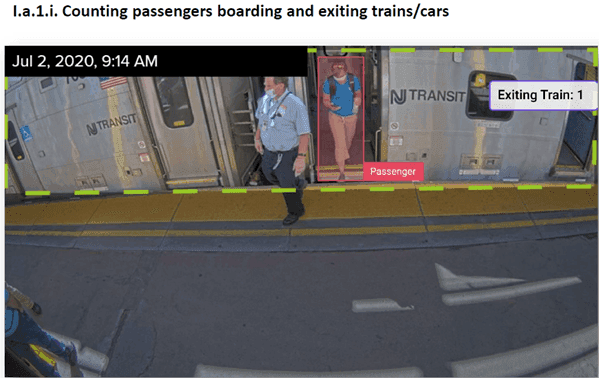
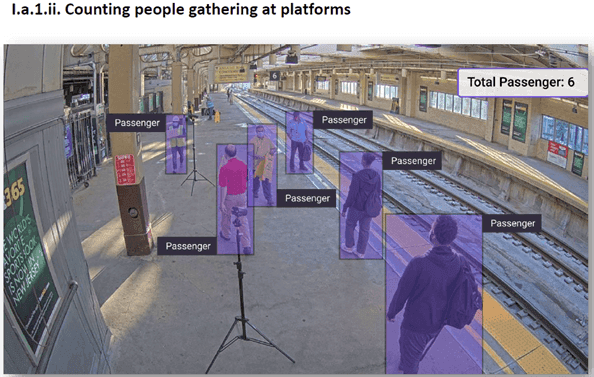
Technologies like artificial intelligence (AI, which translates massive amounts of data using algorithms and computer-based instructions into actionable information) also provide opportunities to capture and use new sources of real-time data to inform transit decisions. In New Jersey, NJ TRANSIT conducted a pilot program with AECOM to configure existing cameras with AI software to identify crowding, determine train capacity, and capture and count passengers boarding, exiting, and awaiting trains at specific station platforms and routes (Chong, J, 2021). Combining existing transportation camera and sensor infrastructure with digital solutions like artificial intelligence and machine learning opens up new use cases to better understand near-term needs and conditions, and convert data into meaningful and actionable insights.
Planners are already adept at gathering, analyzing, and interpreting multiple data sources to inform planning decisions. New and emerging digital approaches such as these demonstrate that we can do more with the data we already have- by disaggregating it to focus on often overlooked issues related to race, gender, socioeconomics, or geography and making those analyses more accessible and transparent using dynamic data dashboards, and by using digital solutions like artificial intelligence and machine learning to better distill trends and statistics from Big Data to inform service planning decisions today and forecasts for the future.
Beyond communication to engagement
A critical step in the transportation planning process is the ability for communities to review and comment on project alternatives and potential environmental impacts. To date, this process has mainly involved volumes of hard copy documents being placed in public places for review, with digital copies consisting of static PDFs available on project websites. When trying to understand how a project may impact or benefit them, community members are often confronted with reams of paper or long lists of PDFs that can be difficult to navigate, let alone interact with. Digital solutions can transform this one-way communication to two-way engagement.
In July 2021, The Federal Highway Administration and Arizona Department of Transportation published the nation’s first fully digital, interactive Environmental Impact Statement https://eeus.alytics.com/on a transportation project. The Final National Environmental Policy Act (NEPA) Tier 1 Environmental Impact Statement (EIS) for the Interstate 11 Corridor project used AECOM’s interactive PlanEngage tool, which transforms the way planning documents are communicated, offering greater accessibility and transparency for project stakeholders, agencies, and the public. The tool is interactive, mobile phone friendly, and compatible with third-party language translation. The official document is entirely interactive, allowing readers to zoom in and out of maps and click through layers of information. Readers can comment on any part of the text, geographic area, or transportation alternative as they are reading the document. Steven Olmsted, ADOT Program Delivery Manager, noted some early benefits realized from use of this digital solution. “The FEIS has been out for just 75 days and we are at over 3,000 views. We are very pleased with where it’s at already. We received a lot of responses on the tool, especially how pleased partnering agencies were with the availability of shapefiles and map layers.”
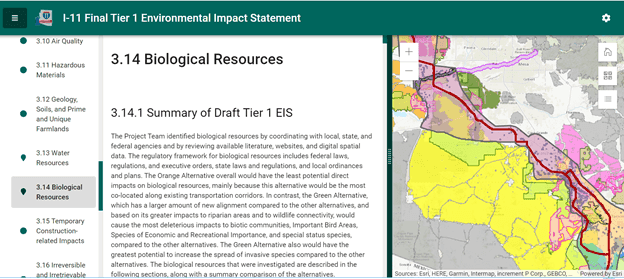
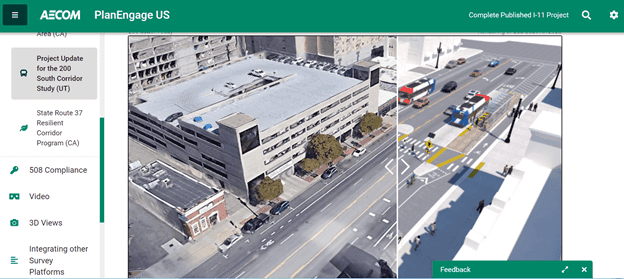
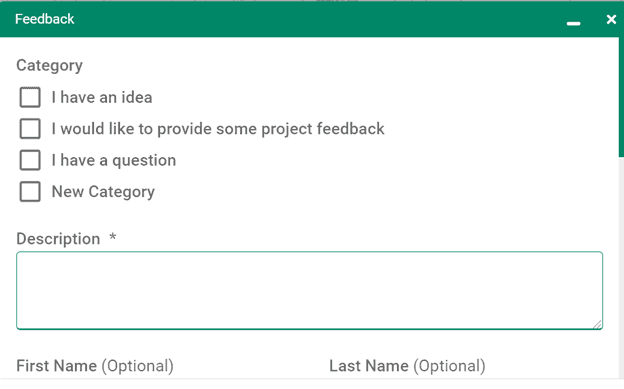
In addition to presenting information in a more engaging and accessible way to communities, PlanEngage enables project teams to create, edit, and publish project information into a single interactive platform, streamlining document production, enhancing efficiency, and improving quality. This includes photos, visualizations, sound demonstrations, videos, project dashboards, models, and narrative. Geospatial information is all in one place, improving quality, reducing errors, saving review time, and eliminating the need to transfer large documents. Prior to the I-11 Final EIS, NEPA documents were moving in the direction of brochures and shortened, graphical PDF (static) documents, resulting in easier to digest content, but losing much of the document specificity and detail stakeholders care about. The I-11 project demonstrates that a digital and interactive approach can deliver both increased accessibility and maintained specificity and detail. Publishing online, interactive content with graphics, videos, and zoomable maps allows readers, including community stakeholders and responsible and trustee public agencies, to drill down into details where needed and truly understand planning projects. A critical consideration when deploying digital solutions for planning project engagement is to use these tools to expand access and complement other approaches, rather than inadvertently reinforce inequities. The PlanEngage platform is fully compliant with Web Content Accessibility Guidelines, which make Internet content more accessible for people with disabilities and traditional PDF and hard copies of the document were also made available on the project website and public libraries.
Connecting the physical to the digital for smarter mobility
Digital planning, design, and engineering help planners, decision-makers, and community members to understand complex and interrelated mobility challenges, and to use digital replicas or “twins” to plan, forecast, deliver, and operate transportation systems. Digital twins combine virtual models with real-time data from a built asset to support more sophisticated simulations and adaptive (and autonomous) interventions. This approach has been used on numerous projects globally, including the Thames Tideway Tunnel, High Speed2 as well as numerous Highways England schemes in the UK (Colclough, J. 2020).
Implementation of digital twins to improve transportation planning requires taking a “digital first” approach for new projects, as well as digitizing existing physical assets which may have incomplete or limited accompanying digital data. A comprehensive digital strategy is critical to best leverage the benefits of digital twins. In the U.S., public agencies are taking the lead to transition to digitally-enabled design that can support future digital twins. The Utah Department of Transportation’s (UDOT) Digital Delivery compiles data “digitally from each stage in the lifecycle of the project, reducing the need for paper, capturing as-built information, and aiding decision making by downstream users” (UDOT, 2022).
The data generated from digital twins can support a variety of beneficial use cases for transportation projects, including improved service planning, proactive and predictive maintenance and asset management, and safety, resilience, and sustainability operational improvements.
A fully connected, automated, and digitized future is on the horizon. As practitioners with a primary obligation to serve the public interest, planners have a responsibility and opportunity to channel digital tools to achieve more equitable outcomes. Careful consideration should be taken to ensure that digital approaches complement traditional ones where needed so as not to reinforce inequities related to the digital divide. Digital solutions can be used to harness more dynamic and real-time data that better represents and makes transparent the diversity of communities, translate static and one-way communication to more accessible and interactive engagement, and connect the physical to the digital for more informed transportation system management, delivery, and maintenance. By embracing, developing, and using digital approaches planners can expand the toolbox of solutions available to create sustainable and equitable mobility solutions for our communities.
Key takeaways
- Be Accessible and Transparent: While digital solutions can help to translate disparate and daunting information into dynamic data insights, the results will hold more value if stakeholders can engage with them in meaningful ways. Be transparent about data sources, digital tools used, and limitations to avoid extrapolating inaccurate conclusions from limited datasets or creating a “black box” that confuses the planning process.
- Expand Engagement and Equity: Use digital solutions and data analysis to better understand differentiated travel needs and patters (by race, gender, income, geography) . Look for who might not be represented in the data or who may not have access to digital tools. Use these insights to develop bespoke combinations of digital and traditional solutions to maximize access and engagement with the planning process.
- Digital is a Tool: Digital solutions aren’t an end in and of themselves. Ask questions based on community needs and priorities. Digital solutions and data science can be used as tools to help understand what is most important to the community and ultimately deliver more equitable solutions that meet the community’s needs.
References
- AECOM. (2022). Digital AECOM.
- AECOM and Seamless Bay Area. (2020, November). Re-imagining transit service in California’s Bay Area post-coronavirus.
- AECOM. (n.d.). Mobilitics.
- Chong, James. (2021). Advancing artificial intelligence: digital transformation during the age of coronavirus.
- Colclough, James. (2020). Digital Twins: Transforming the Way we Build Roads.
- Pew Research Center (2021, April 7). Mobile Fact Sheet.
- USDOT. (2020, November). Operational Connected Vehicle Deployments in the US.
- USDOT. (2022, January). Using Connected Vehicle Technologies to Solve Real-World Operational Problems.
- UDOT. (2022). UDOT Digital Delivery.
